

How to Write an AR Executive Summary Around Three CFO Numbers

Key Takeaways
- CFOs read proposals hunting for the one number that drives decisions. A three-metric summary matches that pattern.
- Oliver Wyman’s CFO Agenda found 65% of CFOs cite enterprise value creation and 62% cite strategic fit as top filters for capital decisions.
- Growth ranks No. 1 for 64% of CFOs, while 60% put cost management beside it.
- The cleanest trio for a SaaS AR case: DSO for liquidity, ARR for growth, and cost-per-invoice or bad-debt for cost management.
- A $600M company running a 90-day cash conversion cycle can tie up working capital.
- Cutting DSO from 60 to 45 days frees capital. No equity raise, no new debt, no headcount cut.
- Boards approve the decision, not the detail. Three numbers beat a 20-page business case.
Why three numbers beat the deck
A CFO reads your proposal the way a board reads theirs: fast, looking for the number that moves the decision. An executive summary built around three metrics respects that. It forces you to answer the only question capital allocation cares about: what does this AR project do for liquidity, growth, and cost?
Picking three numbers isn’t an aesthetic choice. It maps to how CFOs now justify spending. Align your proposal with the filters guiding capital decisions, enterprise value and strategic fit, and three metrics let you answer both on one page.
Why three numbers beat a 20-page business case
Leadership needs a clean, high-level synthesis to act on. When growth and cost management are intertwined rather than competing, your three numbers have to speak to both at once. The proposal addresses expansion and efficiency in the same breath.
To pull that off, pick metrics that represent distinct pillars of financial health. Pair liquidity, growth, and cost control, and each number maps to a stated board criterion. The granular math goes in the appendix.
How big are the stakes you’re summarizing?
Big enough that AR is the fastest lever a CFO controls to free up working capital. Faster collections unlock cash that’s otherwise trapped in unpaid invoices. That liquidity can fund operations directly, without external financing or painful cost cuts.
For SaaS this matters more, not less. Some argue the cash conversion cycle doesn’t apply to software firms because they carry no inventory. That misreads the math. With inventory near zero, the cycle collapses to DSO minus DPO, which makes receivables the dominant driver. DSO isn’t a footnote for SaaS. It’s the whole cycle.
The cost side is just as concrete. Automation dropped processing cost per invoice from $6.30 to $1.45 and let teams handle twice the volume. The AR automation market is projected to grow from $1.9 billion to $3.9 billion. Those figures turn “we should automate” into a dollar line your board can weigh.
What the summary table needs
Each metric needs a current value, a target, a dollar impact, and an owner. That structure turns a claim into a decision. One page, high visual density, low word count.
| Metric | Current | Target | Financial Impact | Owner |
|---|---|---|---|---|
| DSO | 58 days | 43 days | Cash released | VP Finance |
| ARR / collection rate | current | target | Protected revenue | RevOps |
| Cost per invoice | $6.30 | $1.45 | Annual savings | Controller |
One caution on the AI angle. Oliver Wyman reports only 8% of CFOs have deployed AI-assisted tools at scale, even as appetite runs high, and the gap between AI investment and value delivered remains a live issue. So separate pilot claims from at-scale proof in your summary. Leading with AI hype instead of cash math is how these proposals stall.
Picking the three metrics that actually drive the decision
Selecting the right metrics comes down to balance. For a high-growth SaaS firm, the three you choose have to answer three questions: does the project protect cash, does it support growth, does it control cost? That discipline gives the board a full read on operational health.
The point of a three-number summary is exactly that discipline. You want metrics independent enough to avoid double-counting but connected enough to tell one story. Here’s how we pick each, and why SaaS changes the math.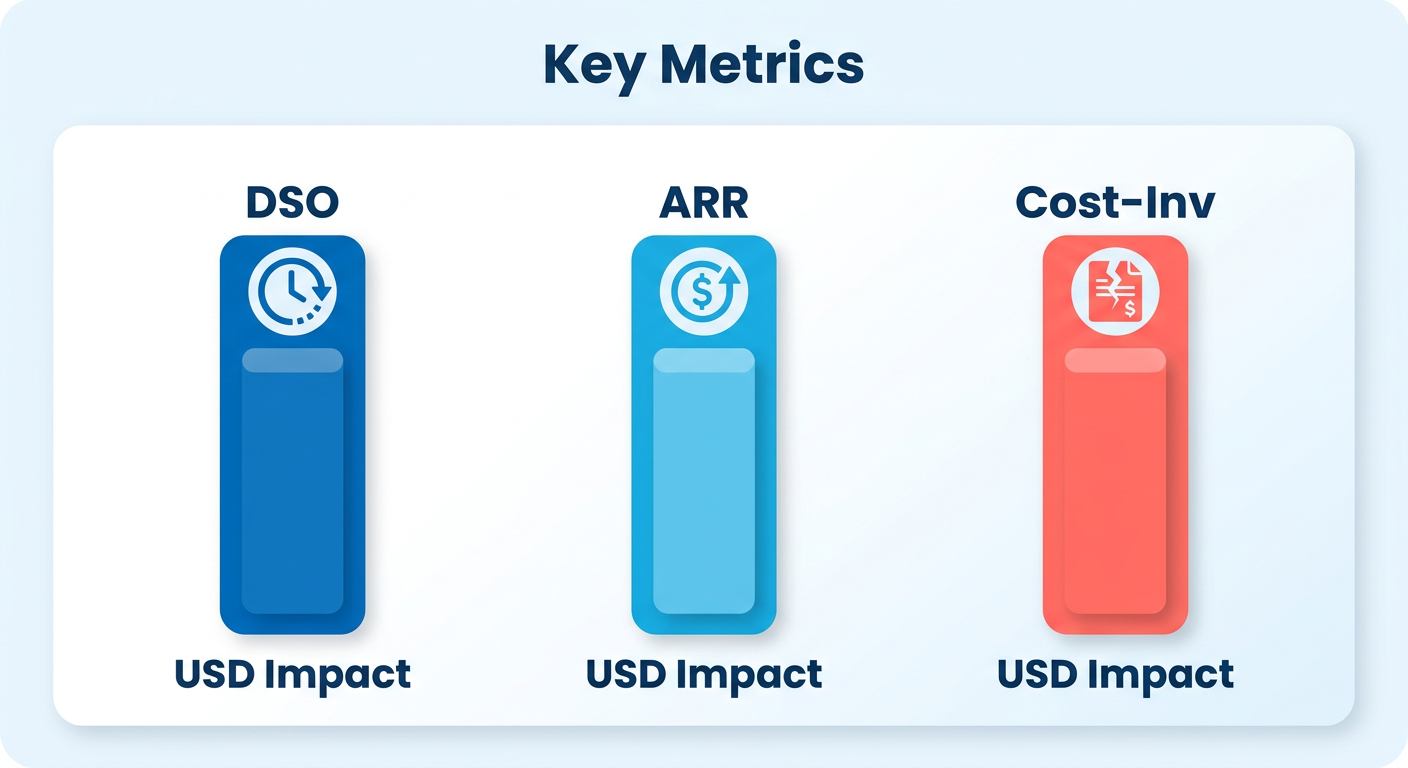
Why DSO is the strongest liquidity number for SaaS
DSO is the average number of days it takes to collect cash after a sale. In a subscription model, it dictates the velocity of your cash inflows. No physical goods means collection speed is the primary determinant of how fast revenue becomes usable cash.
That turns DSO from a simple efficiency metric into a strategic lever. When collections lag, the delay works like an interest-free loan to your customers, and it chokes your ability to reinvest in product or acquisition.
That’s why DSO earns a board slot. The mechanics are simple: multiply daily revenue by days outstanding to see the cash locked in receivables. A firm booking $2 million** in daily sales ties up **$20 million for every 10 days of DSO it carries. Trim even a week off collections and you release capital that would otherwise sit idle. Automating AR is widely regarded as one of the most effective ways to improve collectability and speed up invoice payment. Blixo automates collections, chasing, and dunning to help you get there. Every day cut from DSO is a day of cash back in the business.
How to frame ARR as your growth number
ARR is your growth and enterprise-value number, but only if you define it precisely. ARR is a non-GAAP metric, so the definition carries the credibility. State what’s included, what’s excluded, the data source, and your annualization formula.
Two disclosures worth modeling: Commvault pairs an explicit formula with a clear subscription focus, and Atlassian defines Cloud ARR while acknowledging timing effects and separating it from GAAP revenue. Vague ARR generates analyst skepticism on its own. A board reviewing an AR project wants to see that faster collections protect the ARR they’re funding.
The right cost or risk metric
Your third number covers cost management, a perennial priority for any finance leader. Use either cost-per-invoice or bad-debt ratio, not both. Pick the one your data supports cleanly.
The cost case is concrete. Streamline the invoicing workflow and you cut the manual hours needed to generate, send, and reconcile bills. On the risk side, an average of 4% of receivables get written off as bad debt, which is **$400,000** a year for a $10M-revenue firm. And 39% of US invoices are paid late, so this isn’t a fringe problem.
One rule on independence: your three numbers must move for different reasons. DSO tracks collection speed. ARR tracks growth. The cost figure tracks operational efficiency. If two of them rise and fall together, replace one. Once you’ve locked your three, structure the page so a CFO can absorb them in a couple of minutes. Lead with the figures, then the context.
Turning the metrics into dollars on a page
The math that wins board approval is simpler than most CFOs expect. Convert each of your three metrics into one dollar figure, then show all three on a single visual. That turns a vague “we should automate AR” into a defensible capital ask.
Start with the number that carries the most weight for a SaaS firm: DSO. Subscription businesses run on predictable, recurring cash inflows, not physical assets, so receivables are the primary lever for working capital. An executive summary for a SaaS AR project should lead with cash freed by DSO, not bury it.
How to convert a DSO reduction into cash
The formula: multiply daily revenue by the number of days you cut from DSO. That’s the cash freed up and available for operations.
J.P. Morgan’s own worked example shows a company with $30M revenue and $3M in receivables at a 91.25-day cash conversion cycle. The logic scales with the size of your receivables balance. The more revenue tied up in unpaid invoices, the more a DSO reduction frees. Run your own daily-revenue figure through the formula to size the opportunity.
Here’s what plays well in a board room: that liquidity comes without raising equity, taking on debt, or cutting headcount. The AR lever also moves fastest because it sits closest to cash. In our experience, that no-dilution, no-new-debt framing is what turns a finance project into a strategic one.
Ground your target in real automation data. Even a modest few-day DSO reduction stays defensible when you build it off a realistic projection. Show your daily-revenue math beside it so the board can check the arithmetic in seconds.
What visuals finance executives actually read
Use a waterfall diagram for incremental cash impact, and a table for your three numbers against their targets. A waterfall walks the reader from current cash position to post-automation position, one bar per driver.
Link each metric to one recommendation. A DSO cut maps to “adopt automated invoicing and self-service payment.” A bad-debt line maps to proactive collections. For the cost-savings bar, translate the projected drop in write-offs into a single annual dollar figure so the board reads impact, not accounting mechanics. Pair it with the labor hours automation removes from manual follow-up, since freed staff time reads as a second, quieter return on the same investment.
Label every chart with units, time frame, and assumptions. An unlabeled cash bar invites a challenge; a bar tagged “annual, 6-day DSO reduction, conservative” survives scrutiny.
How to present the sensitivity analysis
Show three scenarios per metric: worst case, base case, best case. For DSO, that’s a 3-day, 6-day, and top-quartile reduction, each with its own cash figure.
A bullet graph works well here. It plots target against actual and a qualitative range, so the board sees where you land versus the goal on one line. Keep the whole thing to a single page so a finance executive can absorb it in a couple of minutes.
Open with a one-sentence recommendation, then let the three visuals carry the justification. The core proposal stays front and center, backed by clean data instead of dense spreadsheets.
The action plan and risk blueprint
The action plan turns your three numbers into a decision the board can approve. It answers the question every CFO asks after the metrics: what happens, when, who owns it, and what breaks. A one-page roadmap mapping each milestone to a KPI improvement does more work than any deck of features.
Keep this part tight. Two artifacts carry it: a time-bound roadmap and a risk-mitigation matrix sitting right beside it. The board reads both in under a minute, then approves or asks one question.
What milestones belong in a concise AR roadmap
A CFO-friendly roadmap has four phases, each tied to one of your three numbers: data migration, pilot, full rollout, and steady-state monitoring. Assign a named owner and a target KPI move to each so accountability is visible on the page.
A structure that works:
- Data migration (weeks 1–4): Clean and load open invoices and customer records. Owner: Controller. Success criterion: reconciled AR ledger with zero orphaned invoices. This phase protects the accuracy of every number downstream.
- Pilot (weeks 5–10): Run automated dunning on one customer segment. Owner: AR Manager. Target: early DSO movement on the pilot cohort.
- Full rollout (weeks 11–16): Extend to all segments. Owner: VP Finance. Target: your headline DSO reduction and cost-per-invoice figures from the analysis.
- Steady-state (quarterly): Review KPIs against baseline. Owner: CFO. Cadence: quarterly KPI review tied to the same three metrics.
Anchor each phase to the dollar impact you already quantified. When the board sees “week 16: DSO down, cash freed,” the roadmap stops being a plan and becomes a return schedule.
How to build the risk-mitigation matrix
Use a simple high/medium/low grid: list each risk, score its likelihood and impact, then name the mitigation and owner. Three risks dominate AR automation projects: data integrity, change management, and integration with your billing and ERP stack. Score each, and the board sees you’ve thought past approval.
Sequence the mitigations by phase so the matrix reads alongside the roadmap. Data integrity is highest-impact during migration, so pair it with the reconciliation gate before pilot begins. Change management peaks at rollout, when the whole AR team switches workflows. Mitigate it with a parallel-run period where the old process shadows the new one until the team trusts the output. Integration risk is worst at the ERP handshake, so mitigate with a sandbox sync test and a rollback plan.
Add a governance row: data security, audit trail, and explainability of any automated decision. Score it high-impact and pair it with concrete mitigations, like role-based access, human sign-off on write-offs, and a documented model of how the collections logic works.
Who owns each item, and how progress gets tracked
Every action item needs one accountable name, not a team. Boards distrust plans where “Finance” owns everything, because no single person answers for a miss. Put the owner beside each milestone and each risk mitigation.
Track progress with a quarterly review against baseline. Reuse the same three metrics from your analysis so the board never relearns the scorecard. If DSO, ARR contribution, and cost-per-invoice moved as promised, the project defends itself. If they stalled, the matrix already named the likely cause and who fixes it.
That discipline is what a two-minute AR summary your CFO actually reads depends on.
Tone, formatting, and getting it read
Write to a CFO the way a CFO writes to their board: formal, precise, stripped of hype. The tone that lands with finance executives is declarative and quantified, not conversational. Every sentence should carry a number, a decision, or an owner. First-person plural is fine for framing the team’s judgment, but the summary itself should read as an institutional document, not a memo from an enthusiast.
Match that restraint to the delivery. A one-page executive summary for a SaaS AR case should ship as a clean PDF, not a slide deck, because a PDF holds its layout across every device and prints identically for the board packet. Save the slides for the live briefing that follows.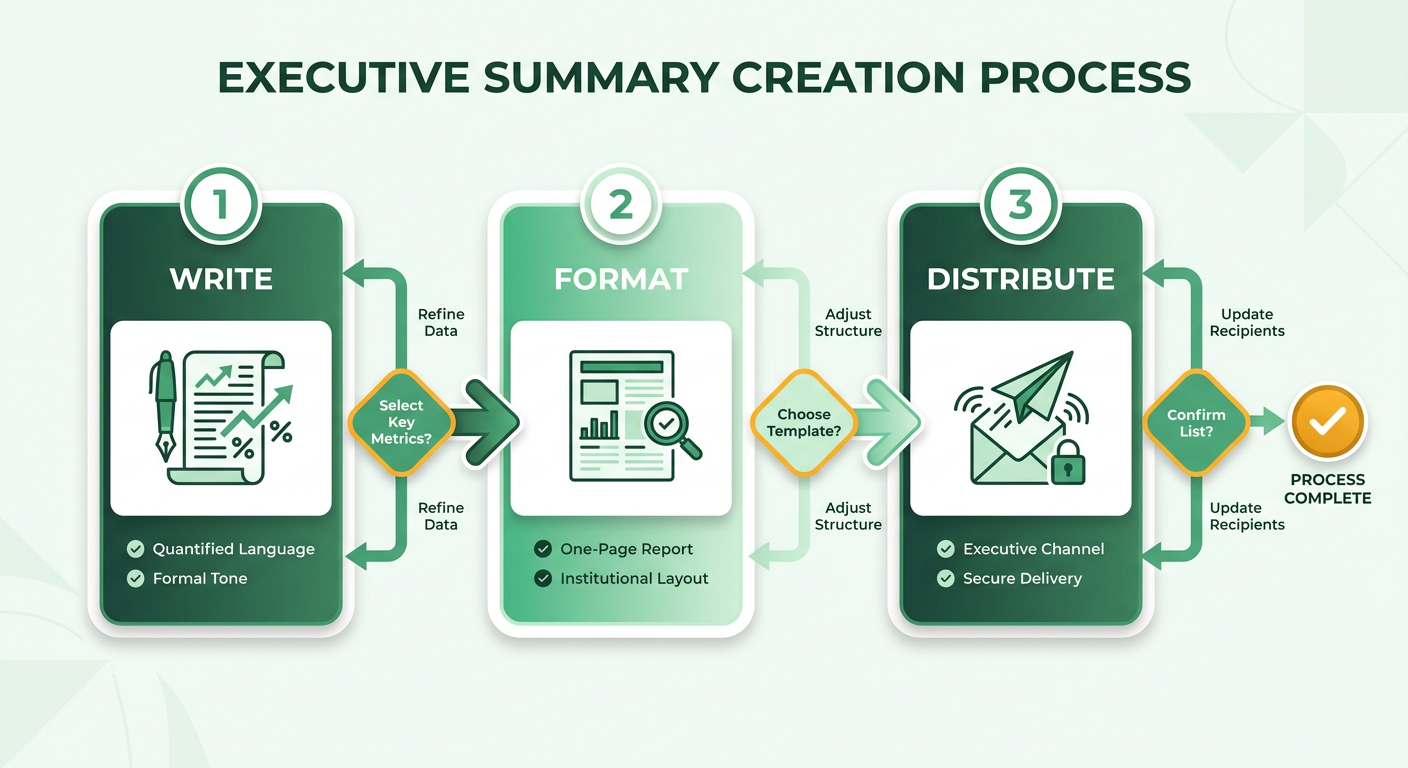
What tone wins with finance leaders
Finance executives trust caution, not cheerleading. The register that earns their attention names constraints before it names gains. A board that has sat through a dozen vendor pitches has learned to discount enthusiasm, so a measured summary tends to be the one that gets a second look.
That skepticism shapes your language. Write in a register that acknowledges risk before it promises upside. If your AR automation touches AI-driven collections or cash-application, name the governance controls in the summary itself. AI “strengthens CFO judgment by providing timely, accurate insights” only when it’s paired with governance and trust.
Skip the aspirational adjectives. A board that reads “reduces DSO by 9 days under our pilot model” trusts you more than one reading “transform cash flow.” Precision reads as credibility.
How to format and distribute the summary
Lead with a PDF attachment, follow with a short call. The workflow we see convert board approval is a two-touch cadence: send the one-page PDF by email with a three-line body, then book a 20-minute briefing to answer questions live. The document persuades; the call closes.
Keep the one-page view clean by footnoting your links, not embedding them inline. If you cite ARR uplift, hyperlink the number to a definition footnote. A clear formula for non-GAAP metrics lets the board verify your methodology without pausing to question the data.
For deeper data, use a single “supporting detail” link at the page footer that points to the full model. That preserves the two-minute read while giving the finance team a path to audit every figure. When your case rests on reconciled, real-time revenue data, a direct path to the billing system of record makes it easy for stakeholders to verify the projections.
Security when you share financials externally
Treat the summary as confidential financial data, even at one page. A summary carrying DSO, ARR, and bad-debt figures is sensitive the moment it leaves the building, and a one-page PDF is no exception.
Send it as a password-protected or access-controlled PDF once distribution goes beyond the internal board. Mark it confidential in the footer. Keep the follow-up briefing deck and Q&A in a permissioned share, not an open email thread.
The trust gap works in your favor here. A board that watches you handle the document securely reads that as evidence you’ll handle the automation securely too.
The review process before you hit send
Before your executive summary leaves the building, run it through a review a CFO would recognize as their own. The goal is simple: no number the board challenges should be one you haven’t already stress-tested. A clean summary that fails one factual check does more damage than a rough draft, because it signals the whole model is loose.
Treat the review as three gates: data validation, peer sign-off, and a compliance pass on anything sensitive. Each gate catches a different failure mode. Skip one and you’re betting the board won’t find what you didn’t look for.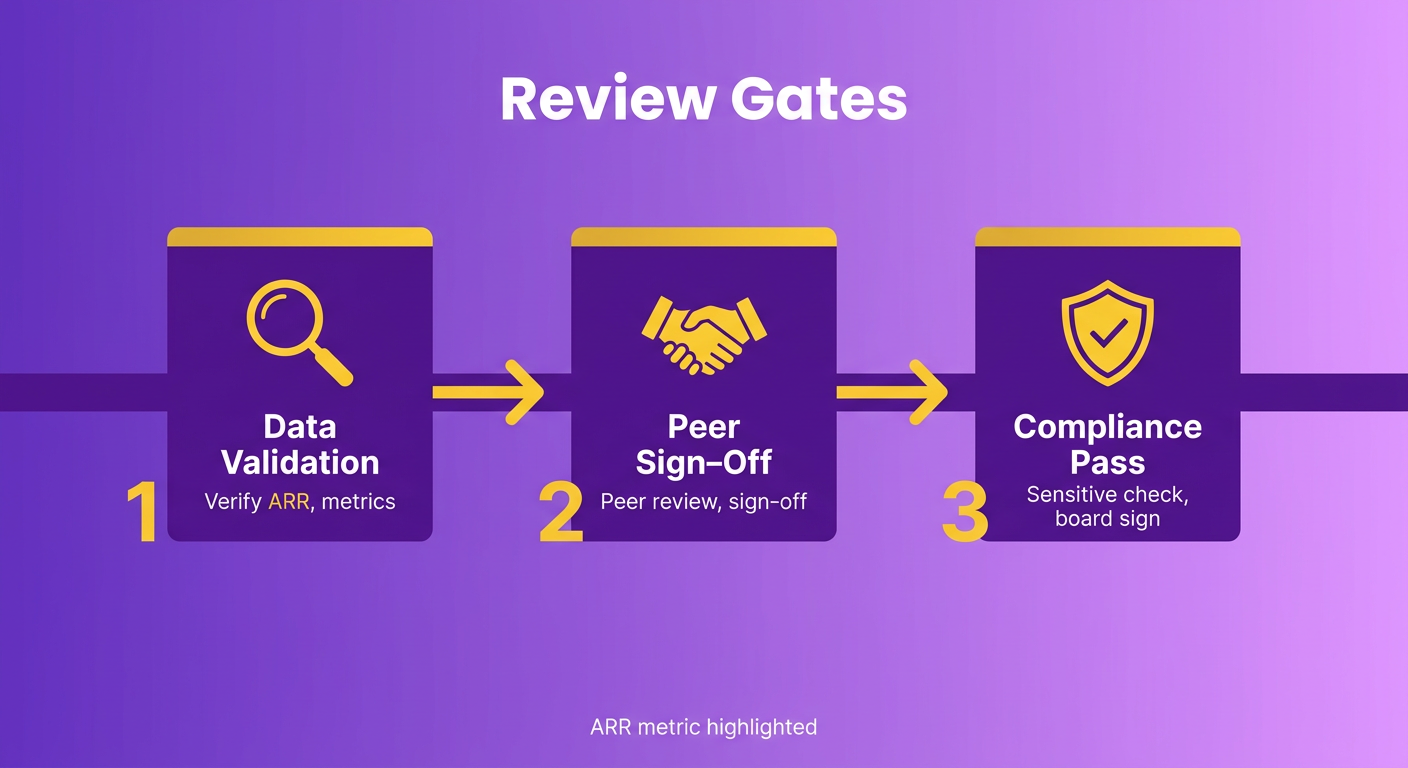
How to validate every number before sign-off
Start with the metric most likely to trigger skepticism: ARR. It lacks a standardized GAAP framework, so its credibility lives or dies on how transparent your calculation is.
So footnote the formula. State what revenue you include, what you exclude, your data source, and your annualization method (TCV/contract days × 365, or MRR × 12). Borrowing the disclosure discipline of major public SaaS firms helps your metrics survive an internal audit.
Our take: cite an ARR uplift from AR automation without that footnote and you risk losing credibility on a heavily scrutinized metric. Reconcile the number back to the billing system of record, not a spreadsheet copy.
What belongs in the peer-review workflow
Route the draft through three reviewers before it ships: the Controller, the VP of Finance, and the CFO. Each owns a different check. The Controller verifies the numbers tie to the ledger. The VP of Finance checks the narrative holds. The CFO confirms the framing survives a board reading.
Lock down version control so this doesn’t turn into a mess of email attachments. Name one master file, track every edit, and never let two people revise different copies. A single-source document is the only way to keep the three-number story consistent from draft to board packet.
Proofread the numbers as carefully as the prose. Rounding drift is the classic tell. If your DSO cash figure rounds to the nearest thousand in a table but the nearest hundred in the body, a sharp CFO notices and starts doubting the rest. Pick one rounding convention and apply it everywhere.
How to archive and track impact after sending
Run a compliance pass, then archive the final with its supporting workpapers. Anything touching customer-level receivables or contract terms should get a quick legal or compliance look before distribution. That matters most when the summary circulates beyond the board.
Store the signed-off PDF alongside the model that produced it, timestamped and locked. When the AR automation project delivers, you’ll want to pull the original summary and compare projected DSO and ARR movement against actuals.
That follow-up is what earns you the next approval. When you reconcile projections against actuals, a unified platform holding real-time ledger data makes it far easier to trace every performance metric back to the billing system of record.
Frequently Asked Questions
1. Should I use cost-per-invoice or bad-debt ratio if I have clean data for both?
Pick only one, even with clean data for both. The three-number rule depends on independence, and both metrics can overlap in what they signal. Choose cost-per-invoice if operational efficiency drives your case, or bad-debt ratio if write-off risk is the board’s concern. Never present both in the summary.
2. What if my board wants the full 20-page business case instead of three numbers?
Keep both, but lead with three. The one-page summary drives the approval decision; the full model belongs in the appendix or behind a single “supporting detail” footer link. This structure keeps the core proposal front and center while ensuring a clear audit path remains available for deeper review.
3. Does the cash conversion cycle really apply to SaaS companies with no inventory?
Yes, it does. Because software firms carry virtually no physical inventory, the traditional inventory component of the cycle drops out. This leaves receivables and payables as the primary variables, meaning the speed of customer collections directly dictates the efficiency of your entire working capital cycle.
4. How much cash could I free by cutting DSO if my revenue differs from the examples?
To calculate your potential cash release, multiply your average daily revenue by the number of days you expect to shave off your DSO. For example, if your daily billings are $500,000, reducing DSO by 10 days unlocks $5 million in immediate, non-dilutive liquidity that can be reinvested directly back into the business.
5. Why shouldn’t I lead my AR proposal with the AI capabilities?
Leading with technology buzzwords often stalls proposals because finance leaders prioritize proven financial outcomes over emerging tech trends. To build trust, focus on concrete cash metrics and operational savings first. If your solution uses advanced automation, frame it as a tool for risk mitigation and efficiency rather than a standalone selling point.
6. How do I keep my ARR number from being discounted by the board?
To prevent your ARR figures from being discounted, provide complete transparency around your calculations. Clearly document your parameters—such as contract exclusions, subscription types, and annualization methods—in a detailed footnote. This proactive disclosure demonstrates analytical rigor and prevents stakeholders from questioning the validity of your growth projections.
7. Why send the summary as a PDF instead of a slide deck?
A PDF ensures that your formatting, charts, and tables remain perfectly intact regardless of the device or operating system the recipient uses. It also prints cleanly for physical board packets. This format encourages a focused, document-first review, allowing you to use the subsequent live meeting to address specific questions rather than presenting slides.