

Write an AR Summary Your CFO Reads in Two Minutes

Key Takeaways
- A good AR summary fits on one page and reads in under two minutes. It pairs cash-application data with renewal forecasts.
- The best CFO snapshot answers three questions: how much cash landed, what’s still outstanding, and what’s coming from renewals.
- Keep the table to five or six metrics. Each should show a current figure, a prior-period figure, and a variance.
- The variance column carries the report. A CFO scans it, spots the two rows trending badly, and stops there.
- DSO dropping from 47 to 41 days means faster collection. Cash applied rising from 88% to 94% means the matching engine is tuned.
- A jump in the 61-90 day bucket from $52K to $85K is a $33K deterioration that needs attention now.
- DSO is the most watched AR metric, and CFOs want it next to standard aging buckets: 0-30, 31-60, 61-90, and 90+.
Quick Summary
A great AR summary fits on one page and reads in under two minutes. It merges two things most finance teams keep in separate tabs: real-time cash-application data and subscription renewal forecasts. That pairing lets a CFO decide, on the spot, whether to push for expansion or tighten collections.
Below is the format we build for CFO dashboards and board decks. Treat it as the top layer. Everything deeper in the article supports it.
What Goes in a Two-Minute AR Snapshot?
A CFO snapshot answers three questions fast. How much cash landed this period? What’s still outstanding? What’s coming from renewals? Keep it to five or six metrics, each with a current figure, a prior-period figure, and a variance. No paragraphs. No footnotes fighting for attention.
Here’s a table structure that works:
| Metric | Current Period | Prior Period | Variance | Comment |
|---|---|---|---|---|
| DSO (days) | 41 | 47 | -6 | Faster collection |
| Cash applied (%) | 94% | 88% | +6 | Matching engine tuned |
| 0-30 day aging | $420K | $390K | +$30K | Healthy |
| 61-90 day aging | $85K | $52K | +$33K | Watch this |
| Renewal forecast (next 90d) | $1.2M | $1.1M | +$100K | Expansion room |
| Collections at risk | $110K | $95K | +$15K | Flag two accounts |
The variance column does the heavy lifting. A CFO scans it, spots the two rows trending the wrong way, and stops there. That’s the two-minute read working as designed.
Which AR Metrics Do CFOs Actually Ask For?
CFOs ask for the same handful of numbers, cycle after cycle. Include these, and you cover most board-level questions:
- DSO (Days Sales Outstanding): How long it takes to collect after invoicing. The most watched AR metric.
- Aging buckets: 0-30, 31-60, 61-90, and 90+. Where the risk hides.
- Cash-application rate: The share of received payments matched to invoices without manual work.
- Collections at risk: Dollar value of overdue accounts likely to slip.
- Renewal forecast: Expected subscription revenue over the next 30, 60, or 90 days.
- Net expansion signal: Renewals plus upsell room minus at-risk balances.
That last row is the decision engine. When renewals outpace at-risk collections, you have room to expand accounts. When at-risk balances climb faster than renewals, you tighten collections first. The snapshot makes that call obvious.
How Do You Make It Readable in Two Minutes?
Design for scanning, not reading. Use one accent color for negative variances. Make the font large enough for a boardroom. Leave real whitespace between rows. A CFO shouldn’t have to squint.
Cut anything that doesn’t change a decision. If a metric never triggers action, it doesn’t belong on page one. Push it to the appendix.
Pairing live cash-application data with renewal forecasts separates this from a static aging report. One shows what happened. The other shows what’s coming. Together they let you act before the quarter closes, not after. The sections below walk through building each row, sourcing the data, and keeping it current.
Why a Fast AR Summary Earns Its Place on the CFO’s Desk
A CFO reads an AR summary to answer one question fast: do we have room to grow, or do we need to chase cash? A two-minute snapshot answers that before the coffee gets cold. The alternative is a ten-tab spreadsheet that buries the signal under formatting.
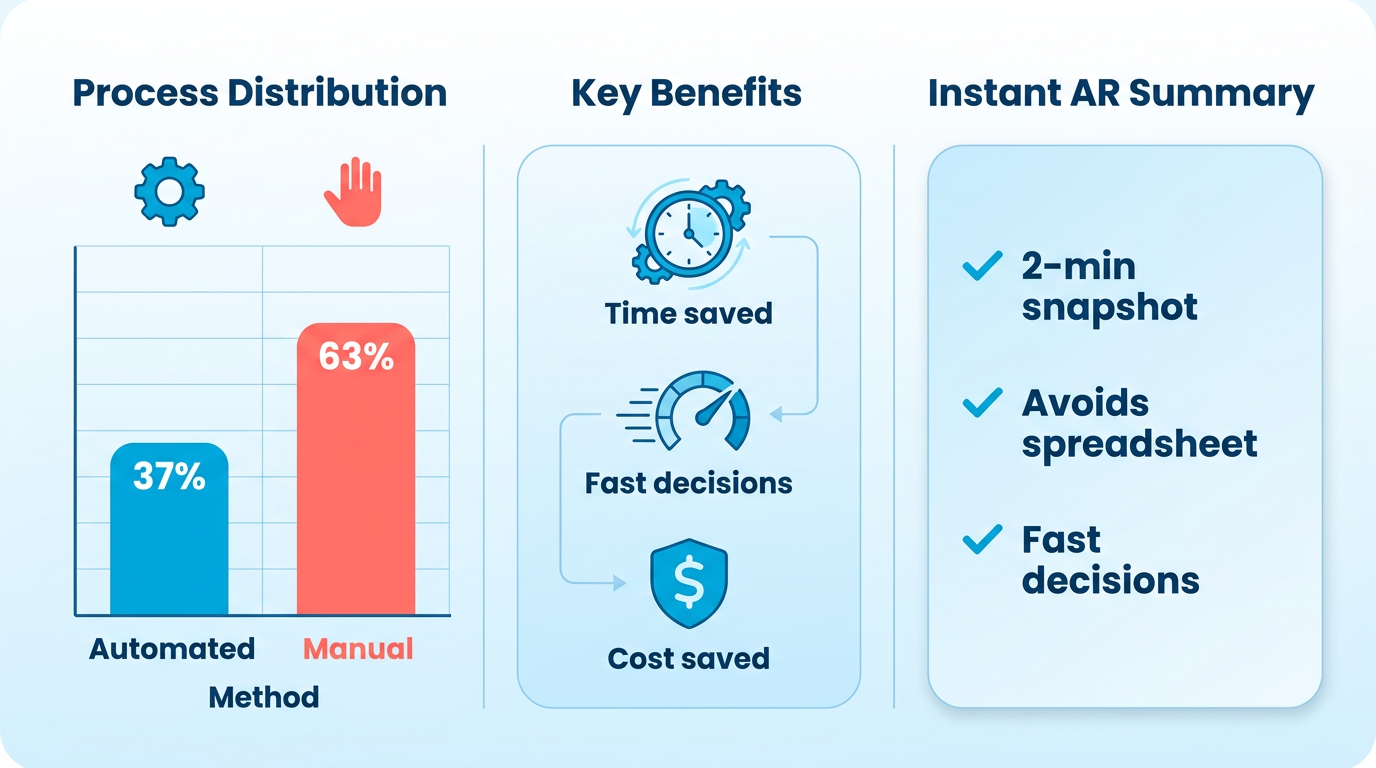
Speed matters because most finance teams are working half-blind on AR. Only 37% of large enterprises have automated their accounts receivable processes. The rest reconcile by hand, which means the numbers on any given AR summary are already stale before the CFO opens them. Stale data leads to slow credit calls, and slow credit calls cost real money.
Why Does Delayed AR Visibility Cost So Much?
Delayed visibility ties up working capital and shrinks your odds of collecting. The math is unforgiving. Accounts more than 90 days past due have only about a 70% likelihood of being collected. Every week your CFO waits for a clean report is a week those aging balances slide toward the write-off column.
That’s the real cost of a long, complex report. Not the hours spent building it. The decisions delayed by it.
When cash-application data lands in real time and sits next to the renewal forecast, the CFO sees aging risk and incoming revenue in the same glance. That pairing turns a backward-looking report into a decision tool.
What Do CFOs Actually Want From AR Reporting?
Three things: cash-flow visibility, risk signals, and speed to both. Traditional reporting fails on all three because the data lives in silos. Collections sits in one system, renewals in another, and cash application in a third. Merging them is the point of a two-minute summary.
The metrics that earn a spot are the ones tied to decisions. DSO shows how fast cash converts. The Collection Effectiveness Index (CEI) shows how well your team recovers what’s owed. The AR Turnover Ratio shows how efficiently receivables cycle. Standardized workflows around these can pull DSO down by three days. Three days of freed cash is meaningful at scale.
The format matters as much as the metrics. A CFO reviewing AR daily or weekly won’t wade through prose. Give them current figure, prior figure, and variance. Done.
How Does This Support Financial Governance?
A tight AR summary moves the CFO from watching transactions to managing receivables with data. That shift is the governance win. Instead of asking “who’s late,” the CFO asks “where do we deploy the cash we’re about to collect?”
Proactive outreach plus data-driven risk scoring lets your team spend energy on the accounts most likely to pay. The summary flags them. Renewal forecasts sitting next to collections data tell the CFO whether an at-risk account is worth the fight or worth expanding.
That’s the choice a good snapshot forces into the open: expand the healthy customers, tighten collections on the shaky ones. You can’t make that call from a report you can’t finish reading. For teams still fighting reconciliation lag, Blixo’s matching engine ties payments and balances back to invoices automatically, which makes the real-time part possible.
The Five or Six Numbers Your Snapshot Actually Needs
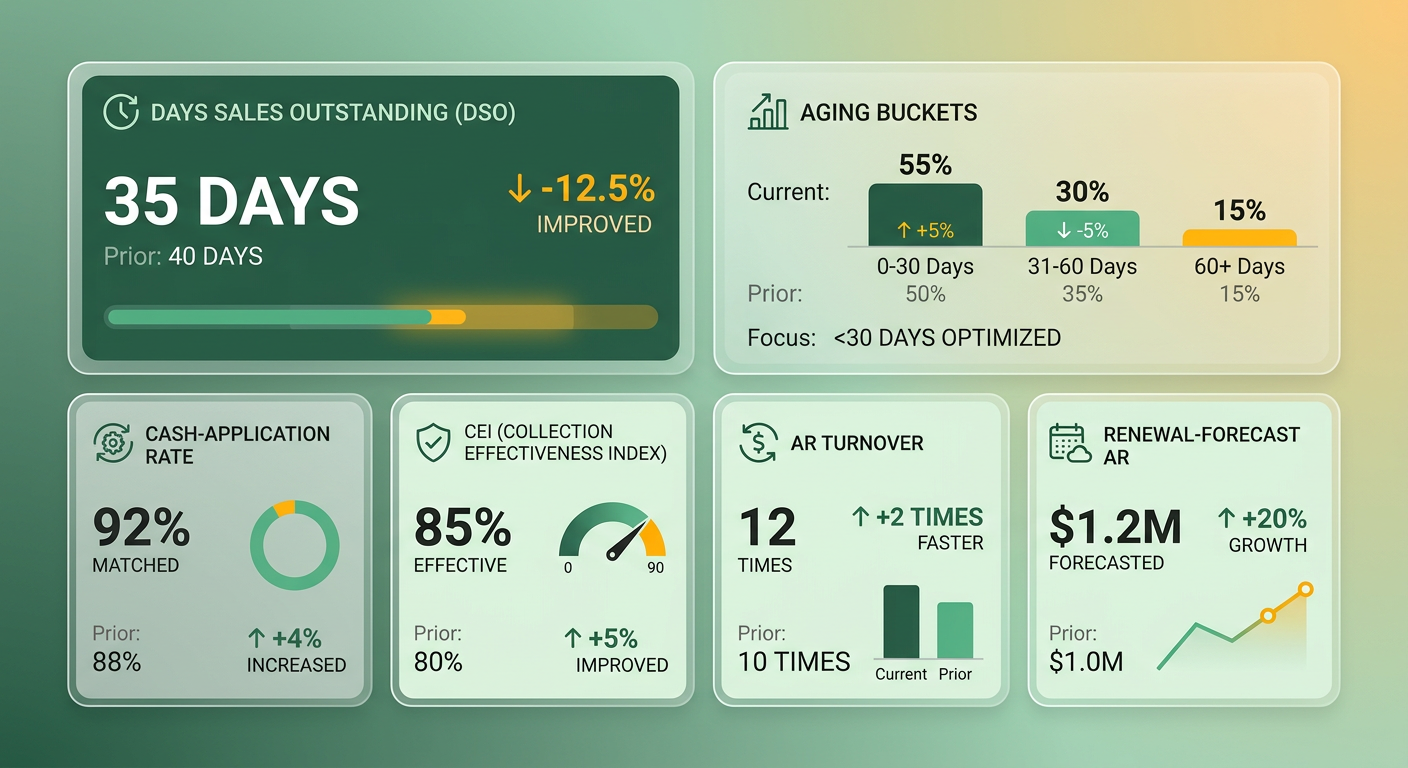
A useful AR snapshot runs on five or six numbers, not fifty. The set we build for CFO decks covers DSO, aging buckets, cash-application rate, the Collection Effectiveness Index (CEI), AR turnover, and one forward line for renewal-forecasted AR. Each gets a current figure, a prior-period figure, and a variance. Nothing else earns space.
That mix separates a working summary from a static ledger dump. The first five metrics tell you what already happened to your cash. The renewal line tells you what’s about to. Read together, they answer the growth-or-collect question in under two minutes.
Which Cash-Health Metrics Belong on the Snapshot?
Three metrics carry the health signal: DSO, CEI, and AR turnover. DSO measures the average days to collect a dollar of revenue. CEI measures how much of your collectible AR you actually pulled in over a period. AR turnover shows how many times you cycle receivables per year.
DSO is the one your CFO scans first. Lower is better, and small moves matter. Speeding up the cycle improves liquidity, which sounds minor until you multiply the daily sales rate across a full receivables balance. On a large book, even a fractional shift in collection speed frees up serious working capital.
Pair DSO with CEI, never alone. DSO can look fine while CEI quietly slips, which means your book is aging even as the average holds. The variance columns catch that drift before it becomes a cash problem.
How Do You Read the Aging and Cash-Application Lines?
Aging buckets split outstanding AR into current, 30, 60, and 90-plus day tiers. The cash-application rate measures how much incoming cash gets matched to invoices automatically versus stuck in a suspense queue.
Watch the 90-plus bucket as your risk flag. Money sitting that long is the money you’re least likely to see, and it drags every downstream forecast. If that tier grows two periods running, that’s your cue to tighten collections regardless of what renewals say.
Unapplied cash makes your DSO look worse than reality, because paid invoices still read as open. A weak match rate is often the real reason for reconciliation bottlenecks that slow cash flow, not slow-paying customers.
What Renewal Metric Ties the Snapshot to Growth?
The forward line is renewal-forecasted AR: contracted subscription revenue due to invoice next period, scored by renewal likelihood. This is the metric that turns a backward-looking report into a decision tool.
Here’s why it belongs next to your collections data. If renewal-forecasted AR is strong and your aging is clean, you have room to expand accounts. If renewals look soft and the 90-plus bucket is climbing, you tighten first. One glance, two levers.
Skip this line only if you bill flat one-off invoices with no recurring base. For anyone with subscription or usage revenue, it’s the metric that moves the CFO from watching cash to steering it.
Turning Numbers Into a Story a CFO Can Act On
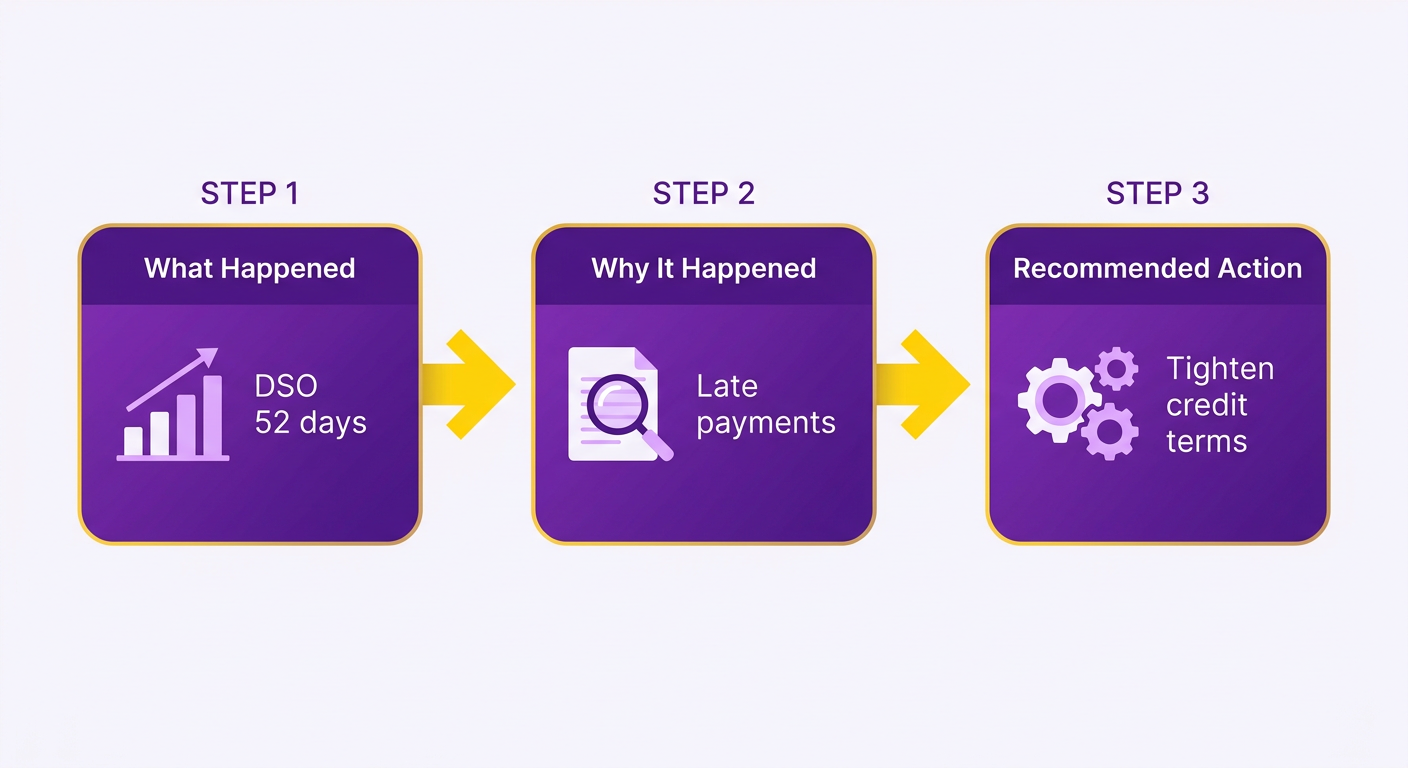
Numbers alone don’t move a CFO. A DSO figure of 52 days means nothing until you say what changed and what to do about it. The narrative is the layer that turns your snapshot into a decision.
We write the story in three beats: what happened, why it happened, and what we recommend. Keep it to a single paragraph sitting right above or beside the metrics. A good summary pairs the data grid with two or three sentences of plain commentary. That commentary is where the growth-or-collect call gets made.
How Do You Write One-Paragraph CFO Commentary?
Lead with the action, not the metric. State the recommendation first, then back it with the number that supports it. A CFO reading a board deck wants the verdict before the evidence.
Here’s the pattern we use:
Cash application rose to 94% this period, and renewal-forecasted AR looks strong at $2.1M across the next 60 days. DSO ticked up 4 days, driven by two enterprise accounts pushing net-45 terms. Recommend expanding credit for the renewal cohort while we tighten follow-up on the two late accounts.
Three sentences. It names a trend, ties it to a cause, and ends with a clear move. No jargon, no hedging. A CFO can act on it or challenge it in seconds.
Which Metric Changes Trigger a CFO Decision?
Certain shifts demand a response, and your narrative should flag them by name. Don’t bury a DSO spike inside a variance column. Call it out and pair it with the driver.
The triggers we watch most:
- DSO climbing 5+ days over the prior period. Usually a signal that either terms loosened or collections slipped. Name which one.
- An aging bucket crossing a threshold. When the 60-to-90 band swells, cash is about to get stuck. Recommend escalation before it hits 90.
- Cash-application rate dropping while invoicing holds steady. That gap points to reconciliation friction, not a demand problem. Automated ledger updates help here. Blixo links incoming funds directly to the right accounts, so reconciliation doesn’t stall.
- Renewal-forecasted AR softening. If the forward line weakens, the growth case weakens with it. Shift the recommendation toward collections.
Each trigger maps to a business driver: new contract terms, seasonality, a collections policy change, or a churn signal in the renewal book. Naming the driver is what separates a report that informs from one that just alarms.
What Tone Keeps a CFO Reading?
Write like you’re briefing a peer, not filing a compliance document. Use action verbs and clear risk language. Say “recommend tightening,” not “it may be advisable to consider.”
Avoid the passive voice that makes finance writing crawl. “Two accounts drove the DSO increase” beats “the DSO increase was driven by two accounts.” Own the analysis. If you think the renewal forecast justifies expanding customers, say so plainly and put the number next to it.
Skip the narrative layer for internal working files nobody reads for decisions. The story earns its keep only when a human is choosing between two paths. On a CFO deck, that’s every time.
Designing a Layout a CFO Can Read at a Glance
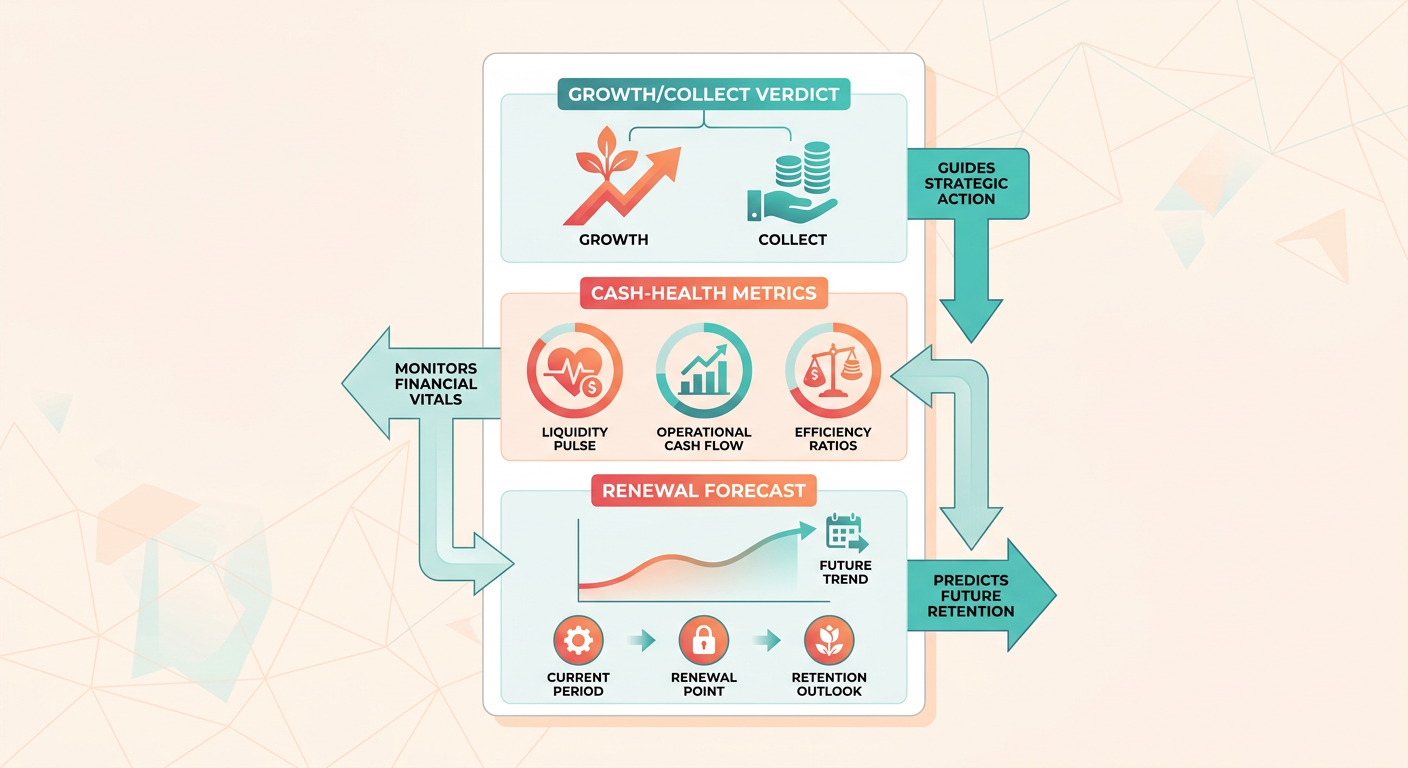
Layout does the heavy lifting on a two-minute AR summary. Your CFO should land on the page and know where to look before reading a single number. That means a fixed hierarchy: the growth-or-collect verdict at the top, cash-health metrics in the middle, and the renewal-forecast line anchoring the bottom.
We build every summary the same way for a reason. Consistency lets the CFO’s eye go straight to the variance column without relearning the page each cycle. Change the layout every quarter and you burn the two minutes you were trying to save.
How Should You Structure the Visual Hierarchy?
Lead with the verdict, then the numbers, then the forecast. Put your one-paragraph commentary and the recommended action in the top zone where the eye lands first. Metrics sit below in a clean grid. The renewal line closes the page because it’s the pivot between tightening collections and expanding accounts.
Size and weight signal importance. Make the headline DSO figure and its variance the largest type on the page. Supporting metrics get smaller, uniform sizing. Anything that isn’t a number or a verdict, like labels and period tags, drops to muted gray so it recedes.
White space is a feature, not wasted room. Crowd six metrics together and the CFO slows down to separate them. Give each figure breathing room and the page reads at a glance.
Where Does Color and Charting Actually Help?
Use color to encode meaning, never decoration. Reserve red, amber, and green for variance direction and aging severity. A heat-mapped aging table lets the CFO spot overdue concentration instantly: darker cells for the 90-plus bucket, lighter for current. That’s one glance instead of scanning ten figures.
Sparklines carry trend without stealing space. Drop a tiny inline trend line next to DSO, cash-application rate, and renewal-forecasted AR. The CFO sees direction and current value in the same cell. No separate chart, no extra page.
Keep charts to what a table can’t show. A single stacked bar for aging buckets or a small line for renewal-forecasted cash flow earns its place. Pie charts and 3-D effects don’t. They add ink and cognitive load without adding a decision.
What Accessibility Rules Protect Readability?
Design for the CFO reading on a phone in a taxi, not a 27-inch monitor. Keep body figures at a readable minimum, and never rely on color alone. Pair every red or green with a sign or arrow so a colorblind reader still gets the signal.
Contrast matters more than palette. Dark text on light backgrounds beats clever gradients every time. If a metric fails a contrast check, it fails the two-minute test.
Build the layout in whatever tool your team already trusts. A spreadsheet, a BI dashboard, or a purpose-built billing platform all work if the hierarchy holds. The tool matters less than the discipline: same structure, encoded color, and a renewal line that keeps the growth-or-collect decision one glance away.
How Blixo Builds These Summaries in Real Time
Automation is what makes the two-minute AR summary possible at all. By hand, this report costs a finance analyst hours of exporting, using VLOOKUP, and reconciling before anyone sees a number. Blixo automates invoicing, collections, cash application, and reconciliation, so the underlying data stays current instead of stale.
The payoff is speed and accuracy at once. A summary that took an analyst a full morning to assemble gets easy to rebuild the moment new cash-application data flows in. That means the growth-or-collect verdict at the top of the page reflects what happened recently, not last week.
Where Does the Data Come From?
The summary pulls from wherever your receivables live: your ERP, your accounting software, and your payment gateways. Blixo connects those sources so cash-application data, open invoices, and payment status all feed one place. No manual export, no copy-paste between tabs.
Cash application is the piece most teams still do by hand. When a payment hits, matching it to the right invoice is where reconciliation stalls. Blixo’s automated ingestion closes that gap, resolving complex payment splits and multi-invoice remittances. Clean cash application is the foundation of any real-time summary.
The renewal-forecast line pulls from your subscription and billing data. That’s the forward-looking half of the snapshot, and it works best when the renewal schedule and the cash-application feed sit in the same system. Blixo’s subscription management and cash application deliver that together.
How Are the Metrics Calculated in Real Time?
Once the data lands, your snapshot can draw on the metrics finance teams rely on: DSO, aging buckets, cash-application rate, and renewal-forecasted AR. Blixo’s aging reports and automatic reconciliation keep the source data current, so the figures you compare against the prior period reflect reality rather than a stale export.
Real-time matters because a credit call made on Tuesday’s numbers is worthless if half your Wednesday payments already cleared. Keeping cash application current keeps the verdict honest. When a large invoice gets paid and Blixo applies it automatically, your DSO figure moves with it before your next board prep.
This is also where accuracy beats manual work outright. Hand-built reports break on a mistyped cell reference or a missed payment. An automated pipeline applies the same matching logic every cycle, and grows smarter through machine learning as you edit. So the numbers you’re reading are real, not a spreadsheet artifact.
How Should You Schedule and Deliver the Summary?
Distribution is the last step, and it should be automatic too. Set the summary to generate on a fixed cadence and push it where your CFO already works: email, a Slack channel, or an internal portal. The report should show up without anyone asking for it.
We recommend a weekly cadence for most finance teams, with an on-demand pull before board meetings. Tie the send to a trigger, like end-of-day cash posting, so the numbers are always fresh when the summary arrives.
Skip the daily send for stable, low-volume AR. A CFO who gets the same verdict five days running stops reading it. Match the cadence to how fast your cash position actually moves, and the two-minute summary keeps earning its two minutes.
Review, Distribution, and Keeping It Sharp
A finished snapshot isn’t done when you hit send. The last mile is governance: validating the numbers, getting sign-off, distributing to the right people, and folding feedback back into the format. Skip this and your two-minute summary degrades into a report nobody trusts.
We treat every summary as a living document with a review cycle attached. That means a validation checklist before distribution, a named owner for sign-off, and a version history you can trace. Standardized workflows aren’t just tidy. They cut real time from your cash cycle, and consistent review is part of that discipline.
How Do You Validate the Numbers Before Sending?
Validate against source before anyone sees the page. The cash-application figures should reconcile back to your payment gateway totals, and the renewal-forecast line should match your subscription system’s committed revenue. If those two don’t tie out, the growth-or-collect verdict on top is guesswork.
Our pre-send checklist is short and non-negotiable:
- Reconcile cash applied against gateway and bank deposits for the period.
- Confirm aging buckets sum to total outstanding AR, no orphaned invoices.
- Cross-check the renewal line to contracted renewals, not pipeline hope.
- Verify variance math so the prior-period column actually reflects last cycle.
One person owns sign-off. In our experience, a single accountable reviewer catches more errors than a committee where everyone assumes someone else looked.
What Feedback Loop Sharpens the Summary Over Time?
The quarterly board or leadership review is where the format earns its keep. That meeting is your best signal source. Watch which line the CFO reads first and which one gets skipped. If nobody looks at AR turnover, it doesn’t belong on the page.
Pay attention to how the summary actually gets used in the room. Note which metrics prompt questions and which ones get passed over. Low interest in a metric is a vote to cut it. Strong attention on the renewal forecast tells you to expand that view.
This is the same shift the whole report is built around: from watching transactions to managing with data. Proactive outreach and risk scoring already help finance teams focus on the accounts most likely to pay. Apply the same instinct to the summary: keep what drives decisions, drop what doesn’t.
How Should You Version and Archive Each Snapshot?
Archive every issued version with a timestamp and the sign-off name attached. When a board member asks why last quarter’s collect call looked different, you want the exact snapshot they saw, not a rebuilt approximation.
Keep a change log for the format too. Note when you added the renewal line, when you dropped a metric, and why. That record stops you from relitigating the same layout debate every cycle.
Iteration should be deliberate, not constant. Change the format when the feedback loop demands it, then freeze it long enough for the CFO’s eye to learn the page. A summary that shifts every month costs the two minutes you built it to save.
Frequently Asked Questions
1. How often should aging buckets be recalculated to keep the summary accurate?
Aging buckets should refresh whenever new cash-application data flows in, not on a fixed manual schedule. When updates are delayed, outstanding balances appear artificially high, leading collections teams to contact clients who have already settled their accounts. Continuous updates prevent these awkward customer touchpoints.
2. What’s the difference between DSO and the Collection Effectiveness Index?
While DSO tracks the average time it takes to convert sales into cash, CEI measures the percentage of total available funds collected during a specific window. Evaluating both metrics together prevents blind spots, as a stable collection average can sometimes mask a growing volume of severely delinquent accounts.
3. Should I include a renewal-forecast line if my business bills one-off invoices?
This forward-looking metric is essential for any business with recurring contract values or usage-based billing. Including upcoming renewals alongside current outstanding balances allows the finance team to assess customer health holistically before initiating contract discussions.
4. How do I decide which metrics to cut from the snapshot?
Focus exclusively on data points that directly influence operational choices. If a metric is merely informative but never prompts a change in strategy or resource allocation, move it to a secondary tab or an appendix to keep the primary dashboard clean.
5. What causes cash-application rate to drop even when invoicing stays steady?
This drop usually indicates operational bottlenecks in payment processing, such as unidentified ACH transfers or missing remittance advice. When incoming funds cannot be automatically paired with open balances, accounts remain marked as unpaid, creating a false impression of collection delays.
6. How do I write CFO commentary that gets acted on quickly?
Keep the narrative concise by starting with your strategic conclusion. Explain the operational driver behind any significant variance, and propose a specific next step. Writing in a direct, results-oriented style ensures the executive team can grasp the situation and approve the plan immediately.
7. Who should own validation before an AR summary goes out?
Assigning ownership to a single team member ensures accountability and consistency. The reviewer should verify that the summary totals align perfectly with your underlying ledger and billing systems, preventing discrepancies from reaching executive leadership.