

Six Numbers That Belong in Every Cash Application Summary Report

Key Takeaways
- Many B2B companies struggle to reconcile cash quickly, often because metric overload buries the signals that matter.
- Six focused metrics can predict cash flow problems earlier than sprawling dashboards packed with receipts, aging buckets, and channel breakdowns.
- When auto-cash hit rate slips, you know right away that something in the application process changed.
- A tight six-number framework gives AR clerks, sales, ops, and executives one set of data to argue from.
- Exhaustive summary reports tend to produce spreadsheets nobody reads and KPIs disconnected from any real decision.
- Each metric answers one question, and together they show whether cash application is healthy or hiding risk.
- More reports won’t fix reconciliation. Narrowing to the right numbers delivers visibility without the noise.
Why Six Numbers Beat a Forty-Row Dashboard
Most finance teams drown in metrics. You open the cash application dashboard and dozens of numbers stare back: total receipts, cleared transactions, deposit counts, aging buckets, channel breakdowns, customer rankings. It looks thorough. But more data doesn’t mean better decisions. Metric overload is a common reason many B2B companies struggle to reconcile cash within a single business day.
The fix isn’t more reports. It’s narrowing to the six numbers that predict cash flow problems before they spiral. Track the right ones and you get visibility without the noise, and your cross-functional teams finally speak the same language.
The Cost of Tracking Everything and Fixing Nothing
Finance leaders often fall into the same trap. They build exhaustive summary reports because they’re scared of missing something. What they get is spreadsheets no one reads and KPIs that connect to no action. Sales doesn’t know which late payments matter. Ops can’t tell whether a process change worked. And the CFO asks the same thing every week: when is the cash actually hitting the account?
A focused six-metric framework answers that. It gives everyone one version of the truth, from the AR clerk matching payments to the executive checking liquidity. Each metric answers one question, and together they tell you whether the process is healthy or quietly building risk.
What a Six-Number Framework Actually Buys You
Faster problem detection. When your auto-cash hit rate drops a few points overnight, you know something changed. Maybe a new payment processor. Maybe a customer switched remittance formats. You don’t wait until month-end to find it. Watching that number closely pays back fast.
Automation ROI you can defend. Finance leaders often say the hard part isn’t buying automation, it’s proving it worked. Track days to reconcile, match accuracy, and exception volume before and after, and the case writes itself. Blixo’s matching engine posts strong match rates at the envelope and item level and gets sharper as you manually apply payments, so the numbers you track keep improving.
Executive confidence without micromanagement. Your CEO doesn’t want a 40-row spreadsheet. They want two answers: are we collecting what we’re owed, and are we doing it faster than last quarter. A tight summary answers both in under 30 seconds.
The Six Metrics That Earn Their Place
Here’s the framework we recommend, built around the benchmarks that separate high-performing AR teams from the rest:
-
Auto-Cash Hit Rate. The percentage of payments matched to invoices with no human involved. Benchmark: 75% or higher. Below that, you’re burning FTE hours on exceptions AI should handle.
-
Average Days Delinquent (ADD). How many days past due receivables sit before collection. Benchmark: four days or less. Hitting it takes automated collection prioritization, not manual follow-up lists.
-
Cash Application Cycle Time. Hours or days from payment receipt to ledger posting. Over 24 hours and your forecast is always stale, your working capital stuck in limbo.
-
Exception Rate. The share of payments needing manual review or rework. Watch it weekly. A spike points to data-quality problems, new customer behavior, or integration gaps.
-
DSO Reduction Progress. Days sales outstanding, tracked month over month. A five-day improvement typically lifts cash on hand by 2–3% of annual revenue. Real money, not accounting abstraction.
-
Cost-to-Collect as % of Revenue. What the whole credit-to-cash process costs you. World-class is 0.04% of revenue. Above 0.10% and the process is bleeding margin.
Six numbers, health at a glance. When all six trend green against benchmark, the engine is humming. When one dips red, you know exactly where to dig.
Why Auditors Care About KPI-Driven Reporting
Consistent, metric-backed reporting is an audit advantage, not just an operational one. When examiners or compliance teams review your AR process, they want documented reconciliation standards and evidence that exceptions get tracked and resolved on a system. A six-metric framework hands them that paper trail without a separate compliance report. You’re already measuring what matters, so the documentation is a byproduct.
Metric #1 – Auto-Cash Hit Rate
Auto-cash hit rate is the percentage of incoming payments that get matched to open invoices automatically, with no manual intervention. It’s the first number to check because it tells you whether your automation is actually doing its job or whether your team is quietly doing the work by hand.
The formula is straightforward: (Auto-matched payments ÷ Total payments received) × 100%. For a subscription business, this metric matters more than raw payment volume, because it determines how quickly your renewal data becomes trustworthy. When a payment auto-applies, your renewal dashboard updates in near real time. When it kicks out to an exception queue, that customer sits in limbo.
What Auto-Cash Hit Rate Should You Target?
A healthy auto-cash hit rate is 75% or higher. Below that, you’re burning FTE hours on exceptions that automated matching should handle. The gap between your current rate and that benchmark represents manual effort you can quantify and eliminate.
The correlation is direct. Higher auto-cash hit rate means lower exception rate and shorter posting cycle time. Standardizing invoice reference formats is one of the most reliable ways to push the rate up, because clean identifiers give the matching engine something dependable to work with.
How Does the Matching Engine Actually Work?
The matching process parses remittance data from multiple sources. Algorithms drive the results, learning from past manual interventions to match your information better next time. An approval workflow keeps you in control while the system refines its accuracy.
Platforms like Blixo can be configured to integrate with your bank and ERP systems, pulling payment data as it lands rather than waiting for manual export. When a payment arrives, the engine attempts to match it against open invoices using the remittance data it received. If it finds a confident match, it posts automatically. If not, it routes to an exception queue for your team to review.
Your Auto-Cash Hit Rate Checklist
Lock these in to protect both your cash and your renewal forecast.
- Enforce invoice reference number standards so every payment carries a clean, matchable identifier. This is among the fastest ways to lift your rate.
- Use bank and ERP integrations so wire transfers, direct deposits, and other payments flow straight into the matching engine instead of the exception queue.
- Train custom rules for your recurring and usage-based billing patterns, since subscription payments repeat in predictable shapes.
- Set a daily match-rate alert that fires when the rate drops below your target for two consecutive days. Two days is early enough to fix config drift before it pollutes a renewal cycle.
- Review exceptions by account, not just in aggregate, because a single logo throwing repeat mismatches is often a churn tell in disguise.
Track this weekly. It’s the fastest read on whether your payment data is ready to drive renewal decisions or still waiting on manual cleanup.
Metric #2 – Average Days Delinquent (ADD)
Average Days Delinquent measures how many days past due your receivables sit before collection. Unlike DSO, which measures the full cycle from invoice to payment, ADD isolates the delinquency window—the period where an invoice is late and your team hasn’t yet collected.
The benchmark is four days or less. Hitting it takes automated collection prioritization, not manual follow-up lists. When ADD climbs above that threshold, it means invoices are aging past due and your collections process isn’t keeping pace.
Why ADD Matters for Subscription Revenue
For SaaS, ADD is a leading indicator of renewal risk. When a customer starts paying later than usual, the drift often comes before a non-renewal. A rising ADD on a single account is a quiet churn signal months ahead of the renewal date.
The renewal link matters more than the cash-flow win. When collections are prioritized automatically, your team reaches out to the accounts that matter most, not just the ones with the largest balances. That delta between “paid on time” and “paying late” is a churn-prediction input grounded in behavior, not survey guesswork.
How Do You Calculate and Segment ADD?
ADD is calculated as the average number of days past due across all open receivables. Run it weekly, then segment by account and region.
- Segment by customer tier. A single enterprise straggler can hide behind healthy SMB accounts if you only look at the aggregate.
- Flag any account whose ADD climbs two cycles running as a renewal-risk candidate and route it to your success team.
- Segment by payment method. ACH and credit card settle on different rhythms, and blending them into one number masks which channel is dragging your delinquency up.
Your ADD Improvement Checklist
Shortening ADD is mostly a collections-prioritization problem. Fix the prioritization and the metric follows.
- Enable automated dunning. Reminders reach customers before their invoices go past due, which cuts the failed renewals that quietly inflate ADD.
- Prioritize collection follow-up by ADD, not balance. A small invoice 30 days past due is a bigger churn signal than a large invoice 2 days past due.
- Route high-ADD accounts to customer success. If a customer is paying late consistently, the issue may be billing friction, not willingness to pay.
Skip aggressive ADD targeting for month-to-month plans with tiny balances. The collection effort costs more than the cash you’d accelerate. Save the intensity for annual contracts, where a late payment genuinely predicts a lost renewal.
Metric #3 – Days Sales Outstanding (DSO)
DSO tells you how long cash sits trapped in receivables before it reaches your account. The formula is simple: (Accounts Receivable ÷ Total Credit Sales) × Number of Days in Period. For a subscription business, the number pulls double duty. It measures collection speed, and it flags renewal risk before your churn dashboard catches on.
That second job is why DSO belongs in a cash application summary report built for SaaS. When a customer starts paying later than usual, the drift often comes before a non-renewal. We watch DSO by account, not just company-wide, because a rising number on a single logo is a quiet churn signal months ahead of the renewal date.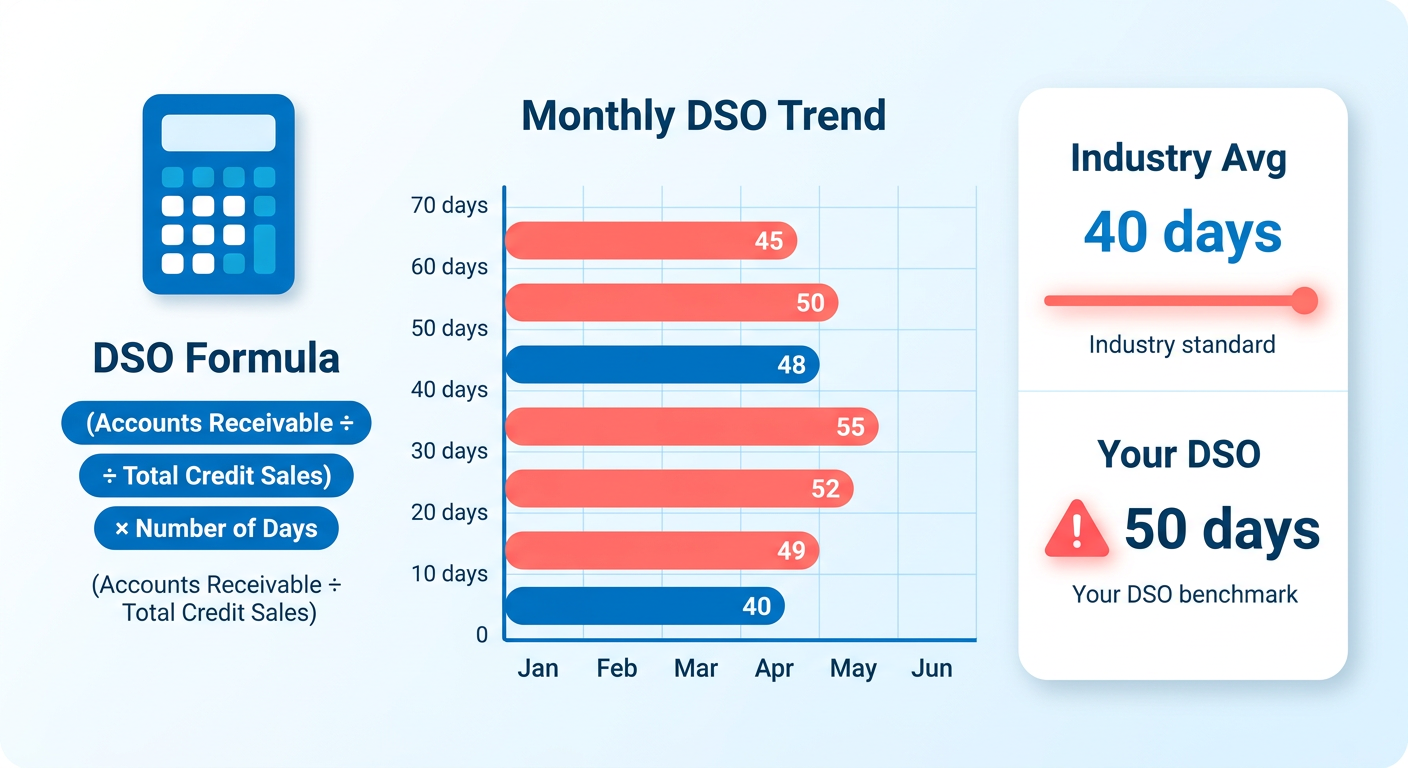
How Do You Calculate and Benchmark DSO?
DSO is the average number of days it takes to collect after a credit sale. Run it monthly, then compare against your industry band.
Benchmarks vary by model. SaaS should target 30 to 45 days. B2B manufacturing runs longer, 45 to 60 days. Professional services land around 40 to 55 days. If you’re a usage-based SaaS business sitting at 55 days, you’re leaking working capital that recurring revenue should protect.
The payoff for tightening it is concrete. Every day you shave off frees liquidity that would otherwise stay locked up. For a mid-market subscription business, accelerating collections means capital to redeploy into growth instead of financing your own late invoices.
Why Cash-Posting Speed Drives DSO Down
Faster posting means lower DSO, full stop. The two are mechanically linked. If a payment lands but sits unmatched for three days, those days count against you.
This is where automation earns its keep. Automated matching applies payments to invoices in seconds, so cash posts the moment it arrives instead of aging in an unallocated queue. Pair that with automated dunning and reminders reach customers before their cards expire, which cuts the failed renewals that quietly inflate DSO.
The renewal link matters more than the cash-flow win. When posting is instant, your summary shows exactly which accounts paid on time this cycle versus last. Feed that delta into your renewal model and you get a churn-prediction input grounded in behavior, not survey guesswork. If you’re weighing whether automation pays back, start by mapping that DSO compression against the working-capital math above.
Your DSO Quick-Win Checklist
Segment first, then pull the levers that move the number. As one order-to-cash guide put it, you can’t manage what you don’t measure.
- Segment DSO by customer tier, region, and product line so a single enterprise straggler doesn’t hide behind healthy SMB accounts.
- Flag any account whose DSO climbs two cycles running as a renewal-risk candidate and route it to your success team.
- Offer early-payment discounts on annual plans to pull cash forward and lock in commitment before renewal season.
- Switch to electronic invoicing so invoices land same-day instead of losing days in the mail.
- Turn on automated reminders and dunning to catch expired cards and forgotten net-30 balances before they age.
Skip aggressive DSO targeting for month-to-month plans with tiny balances. The collection effort costs more than the cash you’d accelerate. Save the intensity for annual contracts, where a late payment genuinely predicts a lost renewal.
Metric #4 – Average Cash-Posting Cycle Time
Cash-posting cycle time measures the hours between when a payment lands and when it posts to your general ledger. Manual teams often run well behind. Automated posting can close that gap significantly. The lag is invisible on most dashboards, which is exactly why it belongs in a summary report built for subscription revenue.
The renewal connection is direct. Every hour a payment sits unposted is an hour your churn model runs on stale data. Fold posting-cycle time into your summary and you tighten the loop between “customer paid” and “customer flagged as renewed.” A slow ledger hides good news as easily as bad.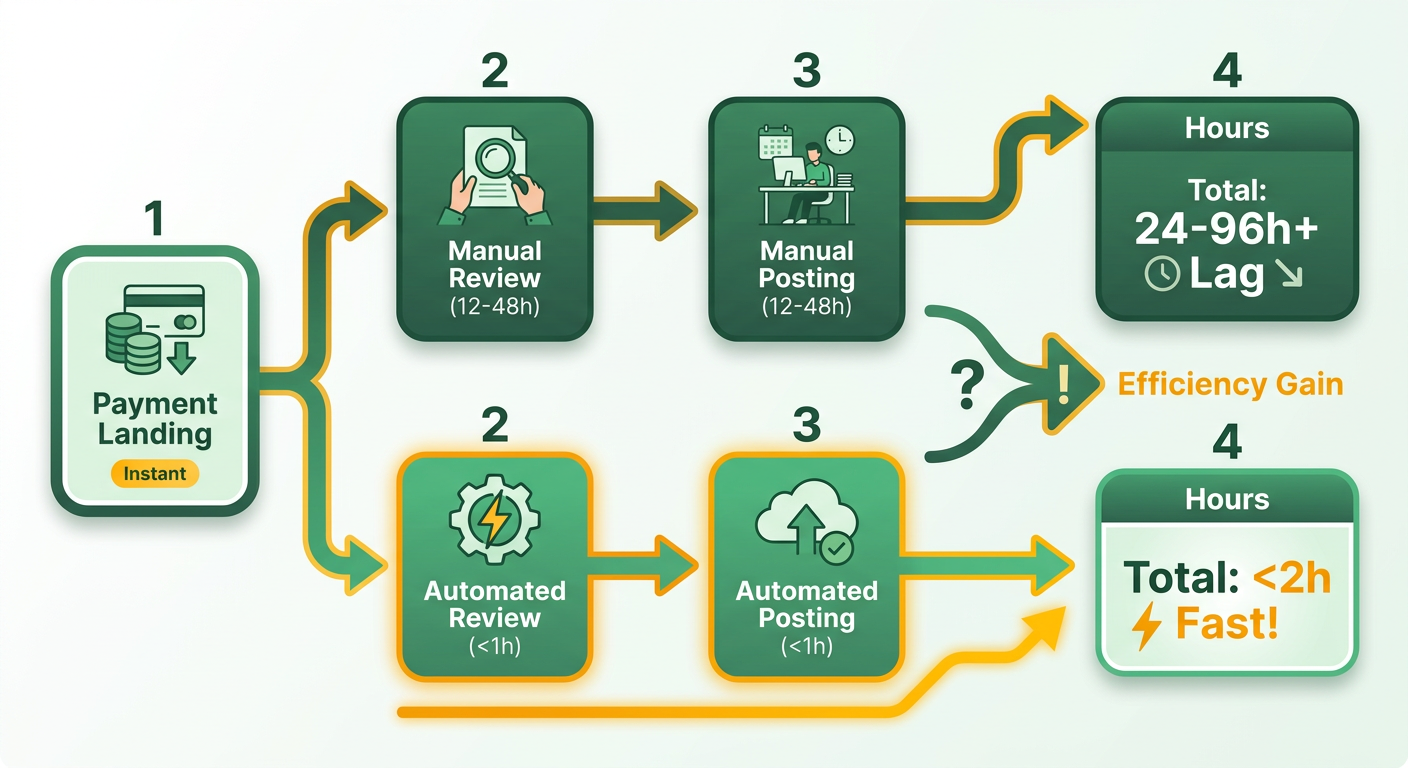
Why Posting Lag Erodes Real-Time Visibility
Cash-posting cycle time is the average elapsed time from payment-receipt timestamp to GL-posting timestamp, in hours.
Slow posting quietly wrecks two things you care about. Your cash forecast drifts because collected money hasn’t been recognized yet, so you either underestimate available cash or scramble to reconcile. That gap raises overdraft risk and pushes you into conservative decisions you didn’t need to make.
For SaaS, the renewal angle sharpens it. A renewal payment that clears Monday but posts Thursday leaves three days where an already-paid account still looks unpaid. Your CS team chases a customer who renewed. Faster posting kills the false alarm and frees the team to focus on accounts that genuinely went quiet.
Modern reconciliation systems can be configured to integrate directly with banks and ERPs, matching wire transfers and direct deposits as they land instead of waiting on an overnight batch. When they apply payments in seconds, the gap between “cleared” and “posted” shrinks fast.
How Do You Measure and Segment This Metric?
Pull two timestamps and subtract them. Payment-receipt time comes from your payment gateway logs. Posting time comes from your ERP or GL logs. Average the difference across all transactions in the period and you have your baseline.
Don’t stop at one company-wide average. Segment it, because the aggregate hides the outliers that cost you.
- Segment by payment method. ACH and credit card settle and post on different rhythms, and blending them into one number masks which channel is dragging your cycle time up.
- Segment by region. Cross-border payments and local banking rails post at different speeds, so regional breakdowns show where reconciliation actually stalls.
What Belongs on Your Improvement Checklist?
Shortening posting time is mostly a plumbing problem. Fix the plumbing and the metric follows.
- Enable real-time webhook posting. Replace nightly batch reconciliation with event-driven posting so a cleared payment hits the ledger in minutes, not the next business day. For example, you can configure your ERP to send a webhook to your customer success platform—like Salesforce or Gainsight—whenever a payment posts, so renewal dashboards update instantly.
- Verify your GL mapping rules. Misrouted payments bounce to a suspense account and wait for manual review, which is where most of the hidden lag lives.
- Reconcile gateway and ERP timestamps monthly. Confirm both systems agree on what “posted” means, so your cycle-time number reflects reality rather than a logging quirk.
Skip the deep segmentation if you run a single payment method in one region. For everyone else, the split is where the churn signal lives. If you’re weighing the effort, automating these matching rules drives real time savings, and the system gets more efficient as your team resolves exceptions.
Metric #5 – Payment Match Rate (Auto-Apply Success %)
Payment match rate answers one question: of every dollar that lands, how much gets applied to the right invoice without a human touching it? The formula is clean: (Auto-matched payments ÷ Total payments) × 100%. For subscription revenue it’s the most telling number you have, because it decides how fast your renewal data becomes trustworthy.
The churn link runs straight through it. When a payment auto-applies, your renewal dashboard updates in near real time. When it kicks out to an exception queue, that customer sits in limbo. For a founder tracking renewal impact, a low match rate means the churn model is guessing on stale inputs. That’s why match rate sits at the top of the numbers you watch.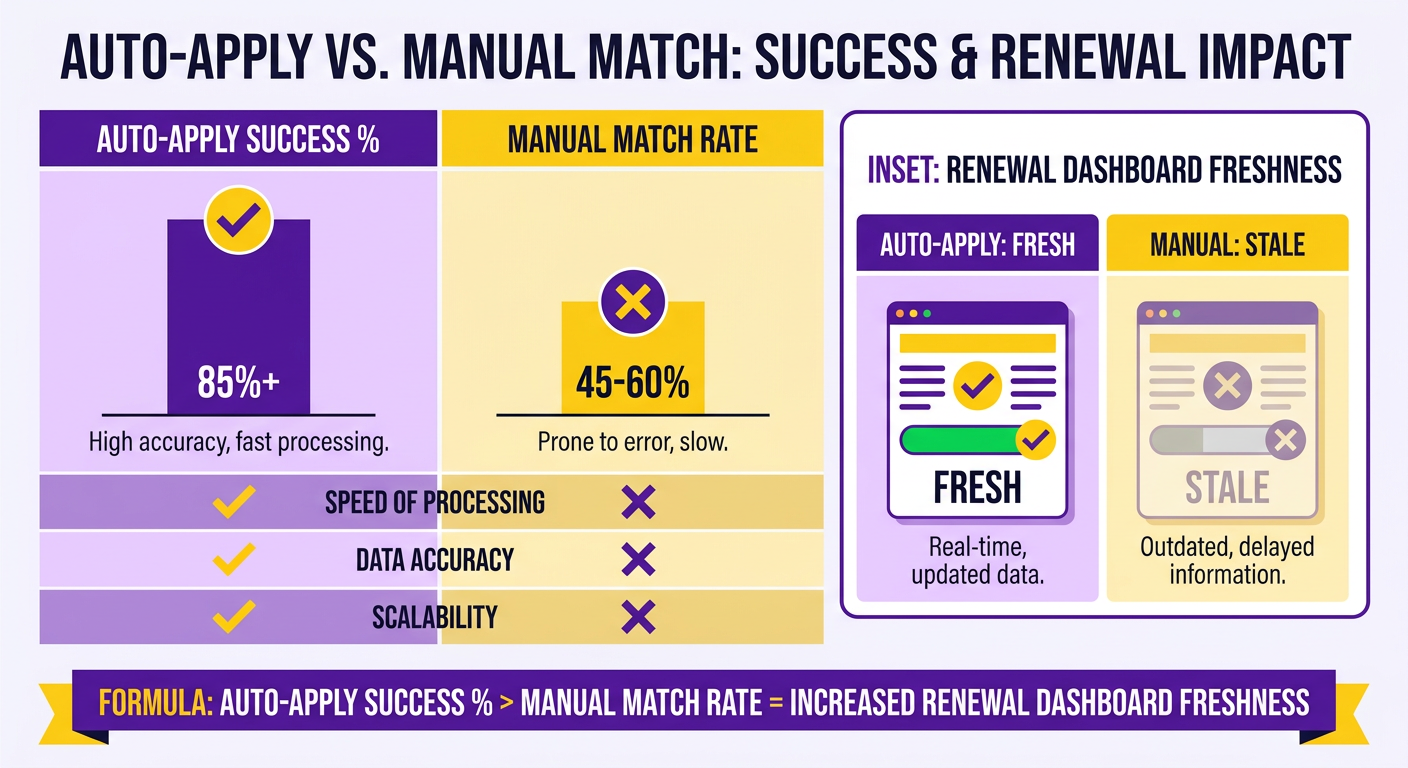
What Match Rate Should You Target?
Payment match rate is the percentage of incoming payments applied to the correct open invoice with zero manual intervention.
Aim for above 95% on a mature AI-driven system. Anything under 80% points to configuration gaps, not bad luck. The space between those two figures is where most subscription businesses lose their renewal clarity. Every point below 95% is payments that arrived on time but posted late, which means renewal signals that fire late too. Closing the gap is less about payment volume and more about how clean your inputs are before they reach the engine.
The correlation is direct. Higher match rate means lower exception rate and shorter posting cycle time. Standardizing invoice reference formats is one of the most reliable ways to push the rate up, because clean identifiers give the matching engine something dependable to work with. That single fix can cut an exception backlog to a trickle.
How Does the Matching Engine Actually Work?
The matching process parses remittance data from multiple sources. Algorithms drive the results, learning from past manual interventions to match your information better next time. An approval workflow keeps you in control while the system refines its accuracy. Together, those steps push match rates past what manual matching delivers.
The flip side is your exception rate: (Unmatched payments ÷ Total payments received) × 100%. Manual processes often run higher exception rates, and each exception costs an analyst time hunting, emailing, and re-keying. Multiply that across a growing subscription base and the drag on renewal velocity is real.
Your Match Rate Checklist
Lock these in to protect both your cash and your renewal forecast.
- Enforce invoice reference number standards so every payment carries a clean, matchable identifier. This is among the fastest ways to lift your rate.
- Use bank and ERP integrations so wire transfers, direct deposits, and other payments flow straight into the matching engine instead of the exception queue.
- Train custom rules for your recurring and usage-based billing patterns, since subscription payments repeat in predictable shapes.
- Set a daily match-rate alert that fires when the rate drops below 90% for two consecutive days. Two days is early enough to fix config drift before it pollutes a renewal cycle.
- Review exceptions by account, not just in aggregate, because a single logo throwing repeat mismatches is often a churn tell in disguise.
Track this weekly. It’s the fastest read on whether your payment data is ready to drive renewal decisions or still waiting on manual cleanup.
Metric #6 – Net Cash-Application ROI (Savings vs. Cost)
The sixth number ties the other five together. Net cash-application ROI measures whether the money you save from faster posting, fewer exceptions, and lower DSO actually beats what you pay for the software running it. The formula: (Annualized Labor Savings + Reduced Bad-Debt + Working-Capital Gains) – Annual Software Cost. A subscription business should close with this figure, because it’s the one your CFO reads first.
For founders, the number also validates your renewal strategy. Every dollar freed from manual matching is a dollar you can redirect toward retention. When we build a summary for renewal-focused teams, we treat ROI as the proof that clean payment data pays for itself. In our experience, that framing wins budget approval faster than any feature list.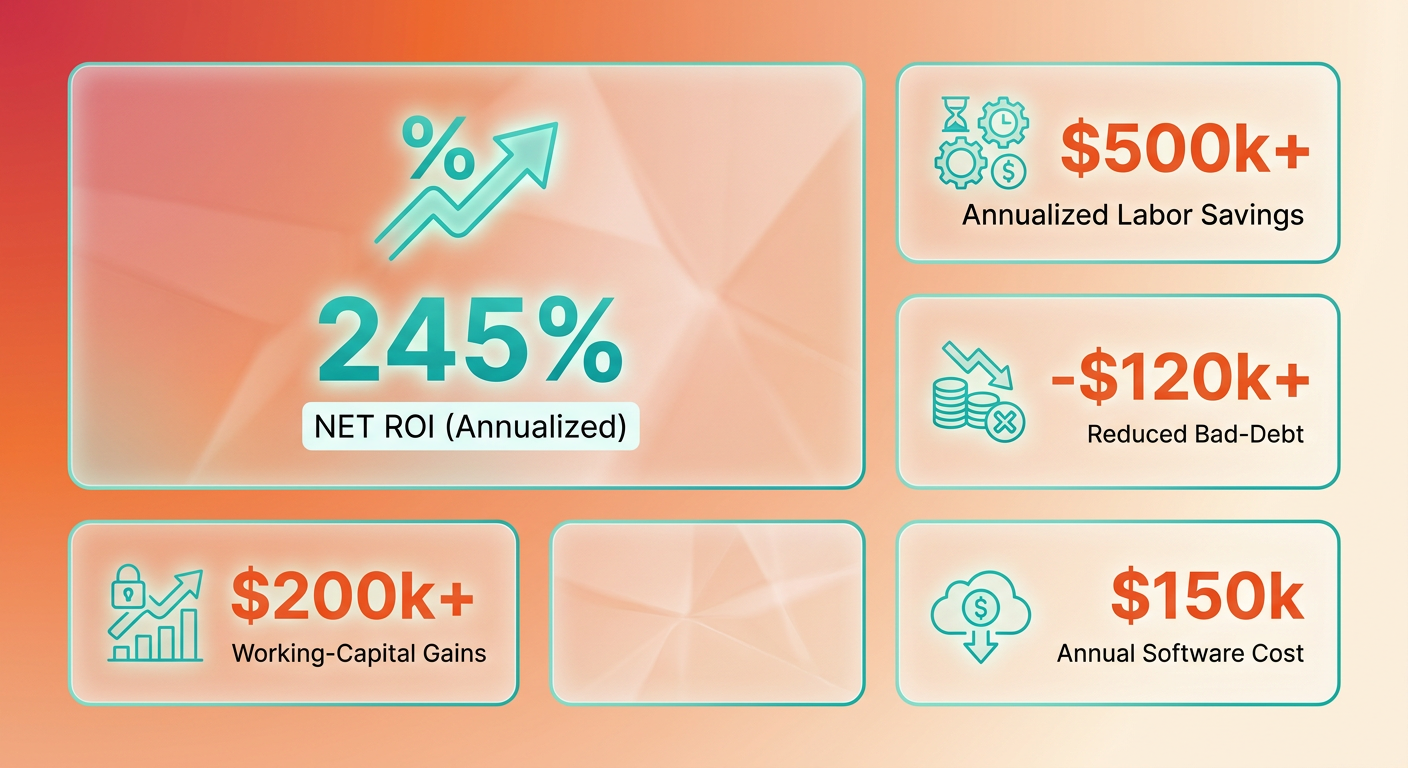
How Do You Calculate Each Savings Input?
Break ROI into three sourced components, then subtract the subscription cost. Each input maps to a metric you already track earlier in the report, so nothing here is a guess.
- Labor savings: monthly exceptions × average handling time × analyst hourly rate, annualized. Fewer exceptions from a high match rate shrinks this line directly.
- Working-capital gain: DSO reduction × daily revenue × cost of capital percentage. A ten-day DSO drop on a business with real daily revenue frees serious cash.
- Bad-debt reduction: historical write-offs × your improvement percentage. Faster posting catches non-payment earlier, before an account slides into churn.
We tie the bad-debt line back to renewals on purpose. A customer heading for write-off is usually a customer heading for cancellation. Catch it early and you protect both the invoice and the logo.
What Does a Realistic ROI Look Like?
The strongest returns show up when a team automates matching and posting together, not one in isolation. When these systems run well, they keep adapting to new payment patterns, so the labor line keeps shrinking over time.
Look at where each input comes from. Automatic reconciliation cuts the exception queue that drives labor cost. A tighter DSO frees working capital you can put back to work. Faster, more accurate posting catches non-payment earlier, trimming the bad-debt line. Run those three against your annual software cost and the net figure is what your CFO reads first. Matching, reconciliation, and collections working in sync is what makes the number hold up.
Skip this calculation if you’re still posting fewer than a handful of payments a week. At that volume the labor savings are too thin to justify the exercise, and your time is better spent elsewhere.
How Do You Present ROI for CFO Approval?
Lead with the net number, then show the three inputs beneath it. Your CFO wants the bottom line first and the working behind it second.
- Put the single net ROI figure at the top of the summary, bolded and annualized.
- Break out labor, working-capital, and bad-debt lines so each is auditable.
- Pair the ROI with a renewal-impact note showing how freed cash funds retention. That connects finance efficiency to revenue growth in one view.
Building the One-Page Report Your Team Will Actually Trust
You have all six numbers. Now you need a repeatable way to assemble them into one page every month. Here’s the checklist we use to turn cash application data into a renewal-strategy tool the whole team trusts.
The goal is a one-page PDF: a Quick Summary table at the top, then two sentences of insight per metric. Anyone should read it in under two minutes and know which accounts are drifting toward non-renewal.
What Goes Into Building the Report Each Month?
Follow these five steps in order. Skip validation and your churn signals run on dirty data.
- Extract the raw data from your invoicing and payment processors. Integration between these systems is what makes an automated report reliable, so confirm both feeds landed before you calculate anything.
- Validate the pull against your bank deposit total. If receipts and deposits don’t reconcile, stop. A mismatch here corrupts every downstream metric.
- Calculate the six metrics using documented formulas. Lock the method so month-over-month numbers stay comparable.
- Compare against benchmarks by account and company-wide. Rising DSO on a single logo matters more than a healthy average.
- Write the narrative summary. Two sentences per metric, plain language, flagging any account whose payment behavior signals renewal risk.
How Should You Visualize Renewal Risk?
Make the page scannable in seconds. Traffic-light colors carry the load: green for on-track accounts, amber for slippage, red for churn-risk logos where payment timing broke pattern.
Add spark-line trends next to DSO and match rate so readers see direction, not just a snapshot. Pair each metric with a variance arrow against last month. Our take: a red arrow on posting-cycle time and a red arrow on a customer’s DSO in the same row is your earliest renewal warning, earlier than the churn dashboard usually catches.
Who Owns the Report and How Do You Keep It Honest?
Assign a single owner per metric and a data-refresh SLA. Without named ownership, the report rots. We set the SLA tight enough that renewal decisions never run on week-old numbers.
- Schedule a monthly review where finance and customer success read the same page together. This is where payment drift becomes a renewal action.
- Automate the feed with a scheduled export into a BI tool like Looker or Power BI. Training staff on the workflow is what actually unlocks the time savings.
- Keep raw data logs for 12 months and document every calculation method. Audit readiness costs nothing when the logs already exist. Scrambling later costs days.
- Run a quarterly benchmark review. Adjust targets and matching rules as your book of business shifts.
That last item is the loop that keeps the report useful. Benchmarks that fit you at $2M ARR won't fit at $10M. If you’re a solo founder still counting deposits by hand, skip the BI export for now. Build the one-page habit first, then automate once the volume justifies it. For teams ready to cut the manual work behind these numbers, an automated cash application platform can streamline the workflow end to end.
Frequently Asked Questions
1. What happens if I only track one or two of the six metrics instead of the full set?
Tracking metrics in isolation hides the connections between them. Match rate, exception rate, and posting cycle time move together—a high match rate shrinks exceptions and speeds posting. Watching them as a group reveals whether cash application is healthy, while single numbers miss the root cause behind a problem.
2. How often should I review each of the six metrics?
Review cadence varies by metric. Watch exception rate and payment match rate weekly, since they flag configuration drift fastest. Track DSO monthly against industry bands, and run a benchmark review quarterly to adjust targets and matching rules as your customer base shifts. Tight cadence keeps renewal decisions off stale data.
3. What is the difference between match rate and exception rate?
These are two sides of the same measurement. Match rate is the percentage of payments auto-applied without manual work; exception rate is the share needing manual review. Raising your match rate directly lowers exceptions, which in turn reduces the manual labor required to clean up unmatched payments.
4. Should a small business bother with this six-metric framework?
Volume determines the payoff. If your transaction volume is low, calculating a complex ROI or aggressively chasing tiny balances on short-term plans may cost more in administrative effort than the cash you would actually accelerate. Focus instead on establishing clean invoicing habits early.
5. Why track DSO by individual account instead of just company-wide?
A company-wide average can mask underlying issues by letting a few late-paying enterprise accounts hide behind healthy SMB accounts. Monitoring DSO at the account level helps identify payment delays early, allowing your team to intervene before the relationship deteriorates.
6. How does cash-posting speed connect to churn prediction for SaaS?
For SaaS, unposted payments mean your customer success team operates on outdated information. If a payment has cleared but hasn’t been recorded in your ledger, you risk reaching out to a customer who has already paid. Accelerating this process ensures your team only contacts accounts that are genuinely delinquent.
7. What benchmarks indicate a healthy cash application process?
A healthy process is indicated when your auto-cash hit rate, average days delinquent, posting cycle time, match rate, DSO reduction, and cost-to-collect all meet or exceed your industry’s standard targets. When these key indicators trend green, your cash application engine is running efficiently.